Social Security Versus Private Security
Abstract
We investigated the Old-Age and Survivors Insurance (OASI) and Disability Insurance (DI) programs within the Social Security Administration for their benefits and sustainability to eligible participants. We contrast these benefits to products offered by private products to create a cost-benefit analysis based on income levels and age. Our analysis shows that out of 96 Social Security benefit income-age scenarios, 67 (70%) scenarios do not achieve a full 30-year retirement based on distributed Social Security benefits. On ages 25-35, we see less than half are able to obtain an adequate portfolio. For ages 40-45, around 5% are able to succeed with a private option. For ages 50 and above, no income can sustain a portfolio able to withdraw equivalent Social Security benefits.
What is Social Security?
Social Security is a welfare program in the United States. It was first established in 1939 to provide private life insurance for families which lost their head of household. After 1939, several additions to the Social Security program were added to provide additional benefits for the disabled, health needs, and supplemental income for the retired elderly. This program today serves 1 in 5 Americans, which is about 63 million beneficiaries.

How is Social Security Financed?
Social Security is financed through a payroll tax. Employers and employees each pay 6.2% of gross wages up to a taxable maximum of $160,200, while the self-employed pay the full 12.4%.
In 2021, $841.38 billion (92.6%) of total Old-Age and Survivors Insurance came from payroll taxes. The remainder income was interest earnings of $67.47 billion (7.4%) (2022 SSA Annual Report).
In 2021, $142.37 billion (98.1%) of total Disability Insurance came from payroll taxes. The remainder income was interest earnings of $2.64 billion (1.9%) (2022 SSA Annual Report).
What are the costs of Social Security?
In 2021, net costs for monthly benefits for Old-Age and Survivors Insurance were $997.93 billion (99.5%), while net administration costs were $4.01 billion (0.5%) (2022 SSA Annual Report).
In 2021, net costs for monthly benefits for Disability Insurance were $140.62 billion (98.3%), while net administration costs were $2.48 billion (1.7%) (2022 SSA Annual Report).
In both accounts, inflows of payroll taxes funds make up almost all revenues. With a 1.9% (OASI) and 1% (DI) adjusted interest yield, income from investing activities makes up very little to the revenues of the program. Administrators of this program have a focus on sustaining inflows into the trust rather than using the funds' capital itself to grow revenue.
Social Security Operations
Eligibility for Old-Age and Survivors Benefits
An individual is eligible for Old-Age benefits once they are 62 years or older and have worked and paid Social Security taxes for at least 10 years (SSA). Those eligible for Old-Age but making more than $56,520 in taxable income will have their benefits reduced by $1 for every $3 over the limit. Those eligible for Survivor's but making more than $21,240 in taxable income will have their benefits reduced by $1 for every $2 over the limit.
One can earn a maximum of four credits each year, with a total of 40 credits to qualify for benefits. For 2023, each credit costs $1,640.
Recent reports show that benefits will need to be cut by about 24.9% by 2034 to keep the program from becoming insolvent (2022 SSA Annual Report). We assume in our analysis that this action is to happen.
Survivors' insurance lasts differently depending on the beneficiaries
- Widows and Widowers
- Mothers and Fathers
- Children
- Parents
Lasts for life, starting at 60 - or 50 if disabled, or unless Old-Age payments are larger.
Lasts until they no longer have a dependent child younger than 16, or retirement age.
Until the child turns 18.
Lasts for life, starting at 62, if the deceased worker supported at least half support.
Eligibility for Disability Benefits
The Social Security Administration determines whether you qualify for disability insurance based on internal review. Although this review is on a per-case basis, the SSA does give some guidelines to their process (SSA):
- The disability significantly limits your ability to do basic work activities - such as lifting, standing, walking, sitting, and remembering - for at least 12 months. If so then,
- A panel of experts finds if the disability matches a listing of disabilities and severities. If the experts agree that the disability and severity both match a current listing of disabilities and severities then,
- The administration determines if the disability limits the ability to do any of past work experiences. If so then,
- The administration determines if there exists any other kind of work that could be done regardless of the disability. If so, then disability insurance is granted.
Disability benefits are not eligible for those currently confined for a crime, not standing trial, or registered as not guilty by reason of insanity caused by mental illness. Those eligible from a disability and able to work but making more than $1,470 per month ($17,640 in taxable income annually) are ineligible to continue benefits (SSA). Approximately 63% of all disability claims are denied (SSA, 2018).
Disability insurance pays for as long as you're disabled, but will stop once retirement age is achieved, in which Old-Age benefits take over.
Private Options
Old-Age Equivalent
There are various account types that can be used for retirement:
- 401K
- IRA
- Taxable Brokerage
- Annuity
401K
A 401K is a tax-sheltered retirement account. This account is funded by pre-tax employment income, which reduces overall taxable income. In 2023, contributions are limited to $22,500. The account funds can be withdrawn at age 59½ without penalty, with its withdrawals counting as income.
IRA
A traditional IRA is similar to a 401K, but is used by those who do not have an employer sponsored 401K plan. Contributions are limited to $6,500.
A Roth IRA is funded by post-tax employment income. In 2023, contributions are limited to $6,500. The account funds can be withdrawn at age 59½ without penalty, with its withdrawals being tax-free. Withdrawals on principle can happen any time without penalty. There are income limits to contributing to this account.
Taxable Brokerage
A taxable brokerage is an investment account that can be funded by any post-tax contributions. There are no income limits, contribution limits, withdrawal limits or penalties. Short-term gains and non- qualified dividends are recognized as income, while long-term gains and qualified dividends are taxed as capital gains.
Annuity
Annuities are financial products which guarantee a certain amount of monthly income. These often require an up-front cost, and provide income for a certain number of years, often sold at various yields.
Our analysis will attempt to pick the best match for the need of each scenario. This analysis does not consider taxes from account withdrawals. Everyone's tax situation is different.
Survivors Insurance Equivalent
Equivalent products to Survivors Social Security Insurance would be private term life insurance.
Private term life insurance pays immediately after death, so it is not exactly equivalent to Survivors Insurance, but this should be regarded as a benefit to the private product.
Disability Insurance Equivalent
Equivalent products to Disability Social Security Insurance would be private long-term and short-term disability insurance.
Private disability insurance pays immediately after a disability, and comes in two forms:
- Short-term
- Long-term
Since Social Security Disability Insurance pays for as long as one is disabled, we will use long-term disability insurance as our private product of choice.
Eliminating Social Security
This analysis assumes an elimination of Social Security taxes and those tax dollars to go back into wages. An elimination of the Social Security program will eliminate these taxes and administrative costs:
- 12.4% of employees and employer shared wage costs, assumed to go to back into wages.
- 0.5% OASI administrative costs.
- 1.7% DI administrative costs.
We will not explore administrative cost savings related to employers not needing to collect these taxes.
Main Analysis
Our analysis will compare Social Security monthly income benefits against a well-structured set of private products across age and income sets. This way we can see the impact on sooner versus later savings and lower versus higher income individuals. We will assume a retirement age of 62 for our calculations, as that is the minimum to receive benefits for Social Security.
This analysis will not make claims on whether benefits are sufficient for a given age, but rather find private solutions that match benefits best.
Old-Age Monthly Benefits
We assume a worker starts at a given age, making a given amount of earnings until retirement at age 62. All numbers calculated using the Social Security Benefit Calculator (SS Calculator). It should be noted that the Age column represents those who started working (paying into Social Security) at that age, not those who are currently at that age. These numbers are inflation adjusted.
Due to insolvency of Old-Age benefits in 2034 and official reporting to its solutions, we will assume retirements after 2035 have their benefits cut by 24.9%.
| Monthly Benefits | Age | 25 | 30 | 35 | 40 | 45 | 50 |
|---|---|---|---|---|---|---|---|
| Annual Earnings | |||||||
| $15,000 | $2,052 | $1,582 | $1,120 | $763 | $490 | $285 | |
| $20,000 | $2,297 | $1,856 | $1,461 | $1,017 | $653 | $381 | |
| $25,000 | $2,543 | $2,044 | $1,594 | $1,233 | $817 | $476 | |
| $30,000 | $2,788 | $2,232 | $1,726 | $1,324 | $981 | $572 | |
| $35,000 | $3,033 | $2,420 | $1,859 | $1,415 | $1,060 | $667 | |
| $40,000 | $3,279 | $2,607 | $1,992 | $1,505 | $1,118 | $762 | |
| $45,000 | $3,524 | $2,794 | $2,125 | $1,595 | $1,177 | $851 | |
| $50,000 | $3,770 | $2,982 | $2,258 | $1,686 | $1,235 | $885 | |
| $60,000 | $4,260 | $3,358 | $2,523 | $1,867 | $1,351 | $952 | |
| $70,000 | $4,751 | $3,732 | $2,788 | $2,048 | $1,467 | $1,021 | |
| $80,000 | $5,241 | $4,107 | $3,054 | $2,229 | $1,584 | $1,088 | |
| $90,000 | $5,713 | $4,483 | $3,319 | $2,410 | $1,700 | $1,156 | |
| $100,000 | $5,943 | $4,821 | $3,584 | $2,590 | $1,816 | $1,224 | |
| $120,000 | $6,403 | $5,173 | $4,067 | $2,952 | $2,049 | $1,359 | |
| $150,000 | $7,092 | $5,700 | $4,441 | $3,434 | $2,398 | $1,563 | |
| $160,200+ | $7,328 | $5,880 | $4,568 | $3,521 | $2,517 | $1,632 | |
Disability Insurance
Assuming starting work at least one year at a given age, making a given amount of earnings, until retirement at age 62. All numbers calculated using the Social Security Benefit Calculator (SS Calculator). It should be noted that the Age column represents those who started working (paying into Social Security) at that age, not those who are currently at that age.
Due to insolvency of Disability benefits in 2034 and official reporting to its solutions, we will assume disability insurance will have their benefits cut by 24.9%.
| Monthly Benefits | Age | 25 | 30 | 35 | 40 | 45 | 50 |
|---|---|---|---|---|---|---|---|
| Annual Earnings | |||||||
| $15,000 | $210 | $105 | $70 | $53 | $41 | $35 | |
| $20,000 | $281 | $140 | $93 | $70 | $56 | $47 | |
| $25,000 | $351 | $176 | $116 | $88 | $70 | $58 | |
| $30,000 | $422 | $210 | $140 | $105 | $84 | $70 | |
| $35,000 | $493 | $246 | $164 | $122 | $98 | $81 | |
| $40,000 | $562 | $281 | $187 | $140 | $112 | $93 | |
| $45,000 | $633 | $316 | $210 | $158 | $126 | $105 | |
| $50,000 | $703 | $351 | $234 | $176 | $140 | $116 | |
| $60,000 | $811 | $422 | $281 | $210 | $169 | $140 | |
| $70,000 | $861 | $493 | $328 | $246 | $196 | $164 | |
| $80,000 | $912 | $562 | $375 | $281 | $225 | $187 | |
| $90,000 | $961 | $633 | $422 | $316 | $253 | $210 | |
| $100,000 | $1,012 | $703 | $469 | $351 | $281 | $234 | |
| $120,000 | $1,111 | $811 | $562 | $422 | $338 | $281 | |
| $150,000 | $1,247 | $879 | $689 | $517 | $413 | $345 | |
| $160,200+ | $1,247 | $879 | $689 | $517 | $413 | $345 | |
Survivors Insurance
Assuming starting work at least one year at a given age, making a given amount of earnings, until retirement at age 62. All numbers calculated using the Social Security Benefit Calculator (SS Calculator). It should be noted that the Age column represents those who started working (paying into Social Security) at that age, not those who are currently at that age.
These estimates include both benefits for a child and a spouse who qualifies for survivors insurance.
Due to insolvency of Survivor benefits in 2034 and official reporting to its solutions, we will assume survivors insurance will have their benefits cut by 24.9%.
| Monthly Benefits | Age | 25 | 30 | 35 | 40 | 45 | 50 |
|---|---|---|---|---|---|---|---|
| Annual Earnings | |||||||
| $15,000 | $527 | $264 | $117 | $75 | $55 | $44 | |
| $20,000 | $704 | $352 | $156 | $100 | $74 | $58 | |
| $25,000 | $880 | $440 | $195 | $126 | $92 | $73 | |
| $30,000 | $1,055 | $527 | $234 | $150 | $110 | $87 | |
| $35,000 | $1,205 | $615 | $274 | $175 | $129 | $102 | |
| $40,000 | $1,267 | $704 | $312 | $201 | $148 | $117 | |
| $45,000 | $1,330 | $792 | $352 | $226 | $166 | $132 | |
| $50,000 | $1,393 | $880 | $390 | $251 | $185 | $146 | |
| $60,000 | $1,518 | $1,055 | $468 | $301 | $222 | $175 | |
| $70,000 | $1,643 | $1,205 | $547 | $352 | $258 | $205 | |
| $80,000 | $1,832 | $1,267 | $626 | $401 | $296 | $234 | |
| $90,000 | $2,059 | $1,330 | $704 | $452 | $333 | $264 | |
| $100,000 | $2,286 | $1,393 | $782 | $503 | $370 | $293 | |
| $120,000 | $2,740 | $1,518 | $938 | $603 | $444 | $352 | |
| $150,000 | $3,233 | $1,719 | $1,173 | $754 | $556 | $440 | |
| $160,200+ | $3,347 | $1,834 | $1,213 | $805 | $593 | $469 | |
Private Solutions
With the eliminated Social Security payroll tax, and our assumptions of those lost wages coming back to wages, those income ranges we have listed out become these now:
| Annual Earnings | Extra Earnings (Annually) | Extra Earnings (Monthly) |
|---|---|---|
| $15,000 | $1,860 | $155.00 |
| $20,000 | $2,480 | $206.67 |
| $25,000 | $3,100 | $258.33 |
| $30,000 | $3,720 | $310.00 |
| $35,000 | $4,340 | $361.67 |
| $40,000 | $4,960 | $413.33 |
| $45,000 | $5,580 | $465.00 |
| $50,000 | $6,200 | $516.67 |
| $60,000 | $7,440 | $620.00 |
| $70,000 | $8,680 | $723.33 |
| $80,000 | $9,920 | $826.67 |
| $90,000 | $11,160 | $930.00 |
| $100,000 | $12,400 | $1,033.33 |
| $120,000 | $14,880 | $1,240.00 |
| $150,000 | $18,600 | $1,550.00 |
| $160,200 | $19,865 | $1,655.42 |
The extra earnings will be used to create a similar scenario to Social Security Old-Age Insurance, Disability Insurance, and Survivors Insurance. We will first find private insurance products for both Disability Insurance and Survivors Insurance that match the benefits for each age group. Any leftover wages will be put into a 401K/Taxable Brokerage as eligible to match benefits at 62. Any wages left over after retirement accounts will be placed into a Taxable Brokerage account. This analysis will not include an IRA portion, as those solutions are more complex.
Private Life Insurance (SS Survivors Insurance)
These numbers were gathered from Fidelity (Fidelity Investments). Our estimates assume the following characteristics:
- Male
- 5' 10"
- Non-smoker
- Average Health
We use term life insurance for at most 20 years or the number of years until retirement, whichever is less. We use a coverage amount that would last 30 years (the equivalent length of Survivors Insurance) of the monthly benefit of the corresponding Survivors benefit.
| Monthly Costs | Age | 25 | 30 | 35 | 40 | 45 | 50 |
|---|---|---|---|---|---|---|---|
| Annual Earnings | |||||||
| $15,000 | $9.68 | $4.93 | $2.47 | $2.04 | $1.90 | $3.46 | |
| $20,000 | $12.06 | $6.57 | $3.29 | $2.72 | $2.56 | $4.56 | |
| $25,000 | $14.31 | $8.21 | $4.12 | $3.43 | $3.18 | $5.74 | |
| $30,000 | $16.46 | $9.84 | $4.94 | $4.08 | $3.80 | $6.84 | |
| $35,000 | $18.19 | $11.48 | $5.78 | $4.77 | $4.46 | $8.02 | |
| $40,000 | $17.45 | $12.28 | $6.59 | $5.47 | $5.12 | $9.20 | |
| $45,000 | $18.32 | $13.82 | $7.43 | $6.15 | $5.74 | $10.38 | |
| $50,000 | $19.19 | $14.58 | $8.23 | $6.83 | $6.40 | $11.48 | |
| $60,000 | $21.39 | $16.79 | $9.88 | $8.20 | $7.68 | $13.76 | |
| $70,000 | $21.62 | $18.56 | $11.55 | $9.59 | $8.92 | $16.12 | |
| $80,000 | $23.31 | $17.83 | $13.22 | $10.92 | $10.23 | $18.40 | |
| $90,000 | $25.83 | $18.72 | $14.01 | $12.31 | $11.51 | $20.76 | |
| $100,000 | $28.02 | $19.61 | $15.56 | $13.70 | $12.79 | $23.04 | |
| $120,000 | $30.18 | $20.87 | $17.84 | $16.42 | $15.35 | $27.68 | |
| $150,000 | $34.63 | $22.74 | $20.94 | $19.62 | $19.22 | $34.60 | |
| $160,200+ | $35.85 | $23.89 | $21.65 | $20.94 | $20.50 | $36.88 | |
Private Disability Insurance (SS Disability Insurance)
These numbers were gathered from Policygenius.
We use long-term disability insurance since that most matches the benefits of Social Security Disability Insurance.
| Monthly Costs | Age | 25 | 30 | 35 | 40 | 45 | 50 |
|---|---|---|---|---|---|---|---|
| Annual Earnings | |||||||
| $15,000 | $13.00 | $17.00 | $21.00 | $25.00 | $29.00 | $33.00 | |
| $20,000 | $17.00 | $22.00 | $28.00 | $33.00 | $39.00 | $45.00 | |
| $25,000 | $21.00 | $28.00 | $35.00 | $42.00 | $49.00 | $56.00 | |
| $30,000 | $25.00 | $34.00 | $42.00 | $50.00 | $59.00 | $67.00 | |
| $35,000 | $29.00 | $39.00 | $49.00 | $59.00 | $68.00 | $78.00 | |
| $40,000 | $34.00 | $45.00 | $56.00 | $67.00 | $78.00 | $89.00 | |
| $45,000 | $38.00 | $50.00 | $63.00 | $75.00 | $88.00 | $100.00 | |
| $50,000 | $42.00 | $56.00 | $70.00 | $84.00 | $98.00 | $111.00 | |
| $60,000 | $50.00 | $67.00 | $84.00 | $100.00 | $117.00 | $134.00 | |
| $70,000 | $59.00 | $78.00 | $98.00 | $117.00 | $137.00 | $156.00 | |
| $80,000 | $66.00 | $89.00 | $111.00 | $133.00 | $155.00 | $178.00 | |
| $90,000 | $75.00 | $100.00 | $125.00 | $150.00 | $175.00 | $200.00 | |
| $100,000 | $83.00 | $111.00 | $139.00 | $167.00 | $194.00 | $222.00 | |
| $120,000 | $120.00 | $160.00 | $200.00 | $240.00 | $280.00 | $320.00 | |
| $150,000 | $125.00 | $167.00 | $208.00 | $250.00 | $292.00 | $333.00 | |
| $160,200+ | $134.00 | $170.00 | $206.00 | $242.00 | $278.00 | $315.00 | |
Net Extra Wages
Taking the extra wages minus the two insurance solutions, we get the extra wages table:
| Monthly Extra Wages | Age | 25 | 30 | 35 | 40 | 45 | 50 |
|---|---|---|---|---|---|---|---|
| Annual Earnings | |||||||
| $15,000 | $132.32 | $133.07 | $131.53 | $127.96 | $124.10 | $118.54 | |
| $20,000 | $177.61 | $178.10 | $175.38 | $170.95 | $165.11 | $157.11 | |
| $25,000 | $223.02 | $222.12 | $219.21 | $212.90 | $206.15 | $196.59 | |
| $30,000 | $268.54 | $266.16 | $263.06 | $255.92 | $247.20 | $236.16 | |
| $35,000 | $314.48 | $311.19 | $306.89 | $297.90 | $289.21 | $275.65 | |
| $40,000 | $361.88 | $356.05 | $350.74 | $340.86 | $330.21 | $315.13 | |
| $45,000 | $408.68 | $401.18 | $394.57 | $383.85 | $371.26 | $354.62 | |
| $50,000 | $455.48 | $446.09 | $438.44 | $425.84 | $412.27 | $394.19 | |
| $60,000 | $548.61 | $536.21 | $526.12 | $511.80 | $495.32 | $472.24 | |
| $70,000 | $642.71 | $626.77 | $613.78 | $596.74 | $577.41 | $551.21 | |
| $80,000 | $737.36 | $719.84 | $702.45 | $682.75 | $661.44 | $630.27 | |
| $90,000 | $829.17 | $811.28 | $790.99 | $767.69 | $743.49 | $709.24 | |
| $100,000 | $922.31 | $902.72 | $878.77 | $852.63 | $826.54 | $788.29 | |
| $120,000 | $1,089.82 | $1,059.13 | $1,022.16 | $983.58 | $944.65 | $892.32 | |
| $150,000 | $1,390.37 | $1,360.26 | $1,321.06 | $1,280.38 | $1,238.78 | $1,182.40 | |
| $160,200+ | $1,485.57 | $1,461.53 | $1,427.77 | $1,392.48 | $1,356.92 | $1,303.54 | |
Retirement
Our retirement analysis will simulate Social Security Old-Age Benefits income, coming from private solutions. To find what private solution would work best, we find a rate of return in that allows us to withdraw equivalent income that lasts for 30 years. For each income range, we will simulate depositing the extra wages into a value-generating account, and then at retirement age of 62, we will withdraw from this account for 30 years.
Using an Efficient Frontier calcuation from Portfolio Visualizer, we can find which sets of portfolios give us pairs of annual expected returns and their volatilities.
| Expected Return | Standard Deviation |
|---|---|
| 4.14% | 2.07% |
| 4.22% | 2.07% |
| 4.30% | 2.09% |
| 4.38% | 2.13% |
| 4.46% | 2.17% |
| 4.54% | 2.22% |
| 4.62% | 2.29% |
| 4.70% | 2.36% |
| 4.78% | 2.44% |
| 4.86% | 2.53% |
| 4.94% | 2.62% |
| 5.02% | 2.73% |
| 5.10% | 2.83% |
| 5.18% | 2.94% |
| 5.26% | 3.06% |
| 5.34% | 3.18% |
| 5.42% | 3.29% |
| 5.50% | 3.41% |
| 5.58% | 3.54% |
| 5.66% | 3.66% |
| 5.74% | 3.78% |
| 5.83% | 3.91% |
| 5.91% | 4.03% |
| 5.99% | 4.16% |
| 6.07% | 4.29% |
| 6.15% | 4.42% |
| 6.23% | 4.55% |
| 6.31% | 4.68% |
| 6.39% | 4.81% |
| 6.47% | 4.94% |
| 6.55% | 5.07% |
| 6.63% | 5.21% |
| 6.71% | 5.34% |
| 6.79% | 5.47% |
| 6.87% | 5.61% |
| 6.95% | 5.74% |
| 7.03% | 5.88% |
| 7.11% | 6.01% |
| 7.19% | 6.15% |
| 7.27% | 6.28% |
| 7.35% | 6.42% |
| 7.43% | 6.55% |
| 7.51% | 6.69% |
| 7.59% | 6.82% |
| 7.67% | 6.96% |
| 7.75% | 7.10% |
| 7.83% | 7.23% |
| 7.92% | 7.37% |
| 8.00% | 7.51% |
| 8.08% | 7.65% |
| 8.16% | 7.78% |
| 8.24% | 7.92% |
| 8.32% | 8.06% |
| 8.40% | 8.20% |
| 8.48% | 8.33% |
| 8.56% | 8.47% |
| 8.64% | 8.61% |
| 8.72% | 8.75% |
| 8.80% | 8.89% |
| 8.88% | 9.03% |
| 8.96% | 9.16% |
| 9.04% | 9.30% |
| 9.12% | 9.44% |
| 9.20% | 9.58% |
| 9.28% | 9.73% |
| 9.36% | 9.87% |
| 9.44% | 10.02% |
| 9.52% | 10.18% |
| 9.60% | 10.34% |
| 9.68% | 10.50% |
| 9.76% | 10.66% |
| 9.84% | 10.83% |
| 9.92% | 11.00% |
| 10.01% | 11.17% |
| 10.09% | 11.35% |
| 10.17% | 11.52% |
| 10.25% | 11.70% |
| 10.33% | 11.89% |
| 10.41% | 12.07% |
| 10.49% | 12.26% |
| 10.57% | 12.45% |
| 10.65% | 12.64% |
| 10.73% | 12.83% |
| 10.81% | 13.03% |
| 10.89% | 13.23% |
| 10.97% | 13.43% |
| 11.05% | 13.63% |
| 11.13% | 13.84% |
| 11.21% | 14.05% |
| 11.29% | 14.26% |
| 11.37% | 14.47% |
| 11.45% | 14.68% |
| 11.53% | 14.89% |
| 11.61% | 15.11% |
| 11.69% | 15.32% |
| 11.77% | 15.54% |
| 11.85% | 15.76% |
| 11.93% | 15.98% |
| 12.01% | 16.21% |
| 12.10% | 16.87% |
| Expected Rate of Return, Volatility | Age | 25 | 30 | 35 | 40 | 45 | 50 |
|---|---|---|---|---|---|---|---|
| Annual Earnings | |||||||
| $15,000 | - | - | - | - | - | - | |
| $20,000 | - | - | - | - | - | - | |
| $25,000 | - | - | - | - | - | - | |
| $30,000 | - | - | - | - | - | - | |
| $35,000 | 11.77%, 15.54% | - | - | - | - | - | |
| $40,000 | 11.29%, 14.26% | - | - | - | - | - | |
| $45,000 | 10.97%, 13.43% | - | - | - | - | - | |
| $50,000 | 10.65%, 12.64% | - | - | - | - | - | |
| $60,000 | 10.33%, 11.89% | 11.37%, 14.47% | - | - | - | - | |
| $70,000 | 10.01%, 11.17% | 10.97%, 13.43% | - | - | - | - | |
| $80,000 | 9.84%, 10.83% | 10.73%, 12.83% | 11.37%, 14.47% | - | - | - | |
| $90,000 | 9.68%, 10.5% | 10.33%, 11.89% | 11.13%, 13.84% | - | - | - | |
| $100,000 | 9.36%, 9.87% | 10.17%, 11.52% | 10.97%, 13.43% | - | - | - | |
| $120,000 | 8.96%, 9.16% | 9.52%, 10.18% | 10.65%, 12.64% | - | - | - | |
| $150,000 | 8.32%, 8.06% | 8.8%, 8.89% | 9.44%, 10.02% | 10.65%, 12.64% | - | - | |
| $160,200+ | 8.24%, 7.92% | 8.56%, 8.47% | 9.12%, 9.44% | 10.09%, 11.35% | 11.53%, 14.89% | - | |
In 2023, these were household incomes by age:
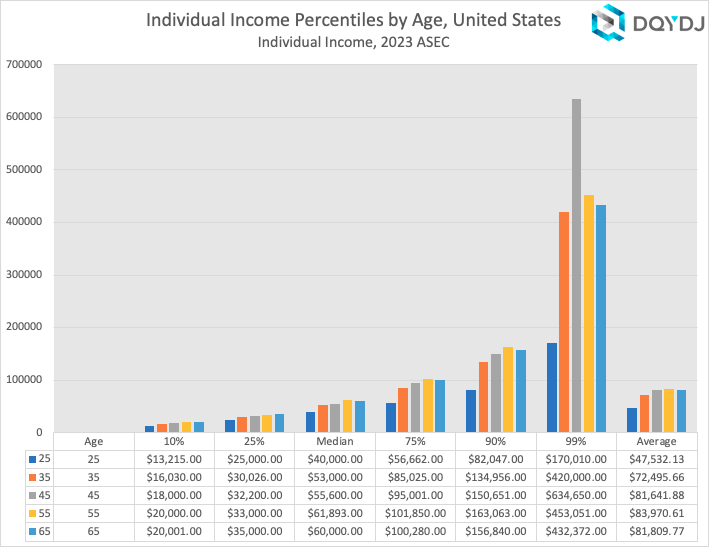
Using the data, we can estimate how much of the population would be able to switch to a private system, while keeping similar benefits.
For age 25, one needs an income of at least $35,000 to qualify. Since we only have data points for 10%, 25%, 50%, 75%, and 90%, we'll interpolate the rest. We'll use this kind of analysis on all ages.
Using trendline analysis, we get the following equations for each age, where x is the percentile and y is the income:
- Age 25:
y = 16110e1.7643x - Age 30:
y = 18043e1.9499x - Age 35:
y = 16991e2.2456x - Age 40:
y = 17572e2.2009x - Age 45:
y = 17592e2.3288x
With the above equations, we can plug in our lowest income that has an existing portfolio into y, and solve for x. This will
give us the percentage of individuals in that age group that meet at least those incomes.
- Age 25, $35,000: 35.24%
- Age 30, $60,000: 38.38%
- Age 35, $80,000: 31.00%
- Age 40, $150,000: 2.57%
- Age 45, $160,200: 5.15%
Conclusion
Our analysis shows that out of 96 Social Security benefit income-age scenarios, 67 (70%) scenarios do not achieve a full 30-year retirement based on distributed Social Security benefits. On ages 25-35, we see less than half are able to obtain an adequate portfolio. For ages 40-45, around 5% are able to succeed with a private option. For ages 50 and above, no income can sustain a portfolio able to withdraw equivalent Social Security benefits.
Citations
Fidelity Investments, https://www.fidelity.com/.
Bureau, US Census. "How the Census Bureau Measures Poverty." Census.gov, 30 Jan. 2023, https://www.census.gov/topics/income-poverty/poverty/guidance/poverty-measures.html.
"How Much Does Long-Term Disability Insurance Cost?" Policygenius, https://www.policygenius.com/disability-insurance/learn/how-much-does-long-term-disability-insurance-cost/.
Pk. (2023, September 29). Average income by age, Median, top & percentiles. DQYDJ. https://dqydj.com/average-median-top-income-by-age-percentiles/
"Portfolio Visualizer." Portfolio Visualizer, https://www.portfoliovisualizer.com/.
Published by Statista Research Department, and Oct 11. "Median Household Income by Age U.S. 2021." Statista, 11 Oct. 2022, https://www.statista.com/statistics/233184/median-household-income-in-the-united-states-by-age/.
Oact. "Social Security Quick Calculator." Quick Calculator, https://www.ssa.gov/OACT/quickcalc/.
"Social Security Administration." SSA, https://www.ssa.gov/.
United States, Congress, BOARD OF TRUSTEES, et al. THE 2022 ANNUAL REPORT OF THE BOARD OF TRUSTEES OF THE FEDERAL OLD-AGE AND SURVIVORS INSURANCE AND FEDERAL DISABILITY INSURANCE TRUST FUNDS, Social Security Administration, 2 June 2022. https://www.ssa.gov/OACT/TR/2022/tr2022.pdf. Accessed 5 Feb. 2023.
United States, Congress, Office of Retirement and Disability Policy. Annual Statistical Report on the Social Security Disability Insurance Program, Social Security Administration, Oct. 2018. https://www.ssa.gov/policy/docs/statcomps/di_asr/2017/di_asr17.pdf. Accessed 5 Feb. 2023.
Vanguard Target Retirement funds. Vanguard. (n.d.). https://investor.vanguard.com/investment-products/mutual-funds/target-retirement-funds